When you use leverage to trade the forex market your returns can be much higher than most typical non leveraged investments or non-leveraged trading. You only have to put up a small amount of money to control a much larger amount. Small movement can result in much larger percentage profits. Losses can be managed with stop orders and moving stops to breakeven.
To open a leveraged position, you only need to deposit a fraction of the total trade value, called the margin.
Example Leveraged Forex Trading Return Calculation #1:
Account balance: $10,000
Pair: EUR/USD Buy
Deposit Amount for Trade: $1000
Leverage: 100:1
Position size: $100,000 (calculated by multiplying account balance with leverage)
Scenario: Market moves 1% in your favor
Profit: ___ Pips or $1,000
Return on Investment: 100% which is $1,000 profit divided by $1,000 initial investment)
Total Return on Account: Since account starting balance is $10,000 return on account including non-margined funds is $1,000 divided by $10,000 which is 10%.
If you make 4 trades in one month with 1% return each your account balance will be $14,000 at the end of the month which is a 40% return on the total account.
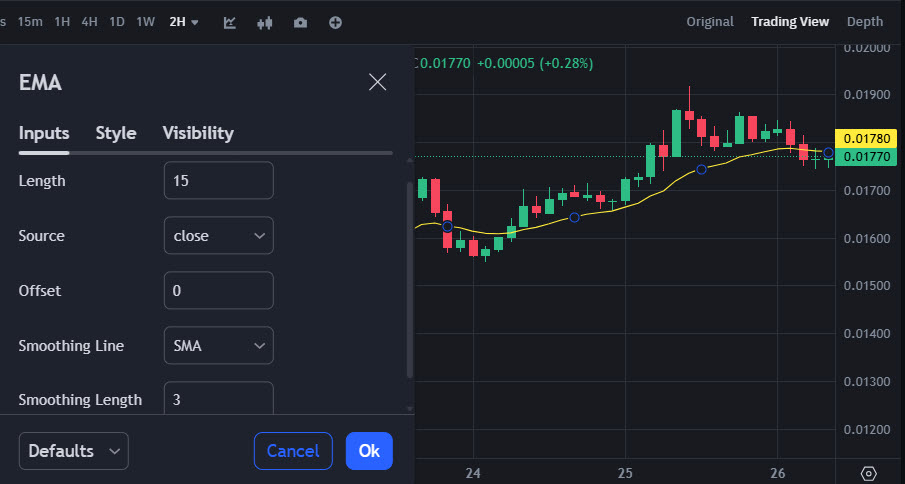
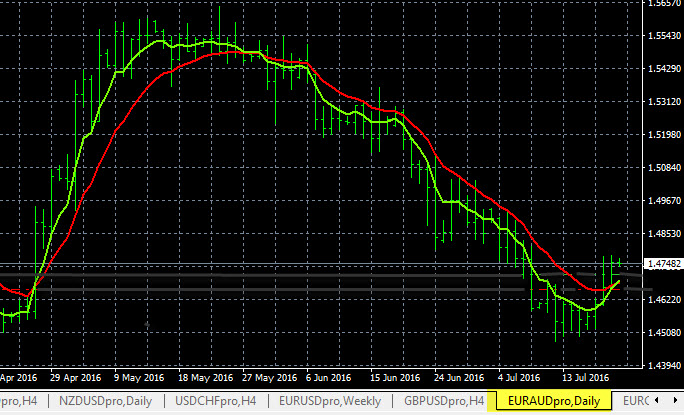
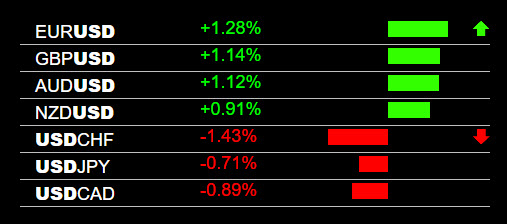
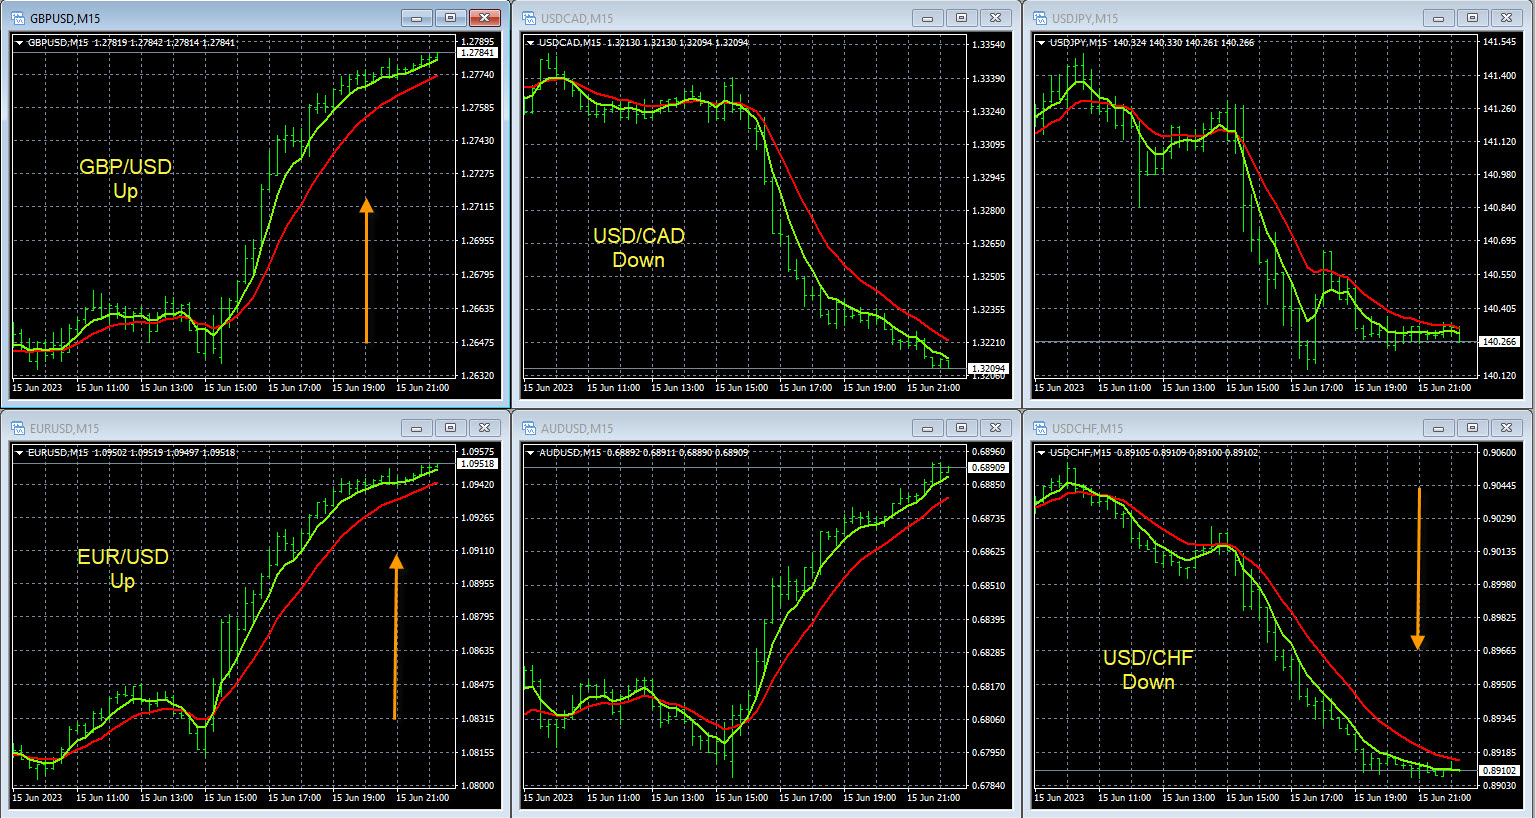
USD IMAGES READY
Example Leveraged Forex Trading Return Calculation #2:
Account balance: $10,000
Pair: GBP/JPY Sell
Leverage: 50:1
Deposit Amount for Trade: $2000
Position size: $100,000 which is $2000 x 50
Scenario: Market moves 200 pips or 1.33% in your favor.
Profit: ___ Pips or $669
Exchange Rate at Entry: 150.00 (1 GBP = 150.00 JPY)
Exchange Rate at Exit: 148.00 (1 GBP = 148.00 JPY)
Position Size: With 50:1 leverage, you control $100,000 worth of GBP/JPY (2,000 * 50).
Number of GBP sold: $100,000 / 150.00 = 666.67 GBP.
Buying GBP back: When the rate drops to 148.00, you buy back those 666.67 GBP for JPY: 666.67 GBP * 148.00 = 98,667.16 JPY Initial Investment = $2,000 (or equivalently, 300,000 JPY at the entry rate of 150 JPY per USD) Final Value in JPY = 98,667.16 JPY, which at the exit rate equals $669.37 (98,667.16 JPY / 148 JPY per USD) Profit in USD = $669.37
Return On Investment: ($669.37 / $2,000) * 100 = 34.7%
Total Return on Account: Since account starting balance is $10,000 return on account including non-margined funds is $669 divided by $10,000 which is 6.7% on one 200 pip GBP/JPY trade.
If you make 2 trades in one month with 6.7% return each your account balance will be $11,338 at the end of the month which is a 13% return on the total account.
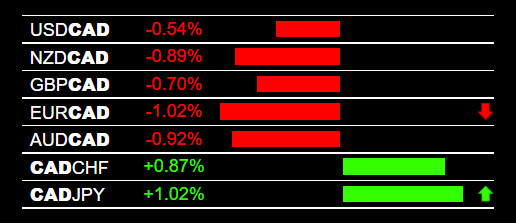
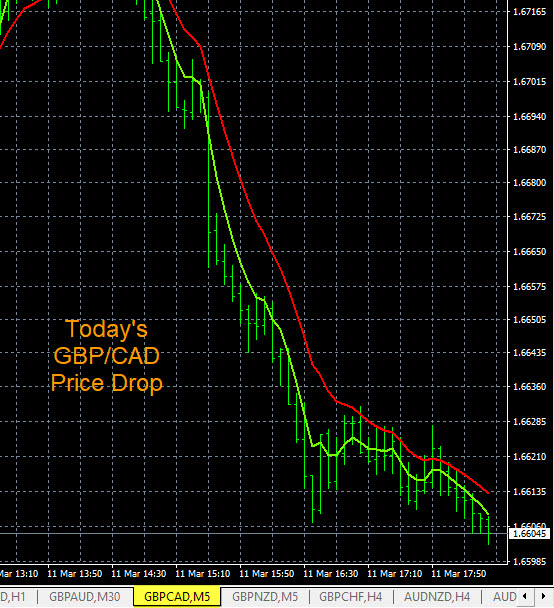
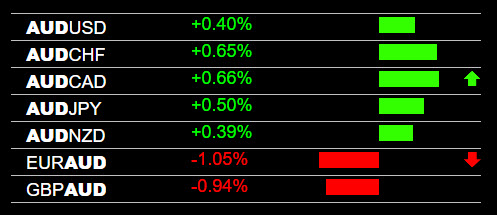
GBP/JPY IMAGES READY
Risk Management
these examples are simplified to focus on the mechanics of leverage in forex gains.