Forex Support And Resistance Levels, Price Alerts
The forex market is a support and resistance market, all trends start and end at support and resistance. All reversals and retracements start at support and resistance. Forex trading becomes a lot easier if you are an expert at identifying key areas of forex support and resistance.
If traders can identify near term support and resistance on the smaller time frames, then compare these levels to longer term support and resistance levels on some simple charts and trend indicators that we will show you in this article, then their understanding of support and resistance will be strong. So we need to divide forex support and resistance into short term levels and longer term levels.
For analysis of the market we use multiple time frame analysis with simple bar charts and exponential moving averages. As the analysis proceeds, we can also analyze support and resistance simultaneously, time frame by time frame. This method of analysis across different time frames is not the standard technical analysis method most traders use when analyzing currency pairs. It is easy to do but actually much more rigorous.
Setting Up Your Charts For Forex Support and Resistance Analysis
To evaluate support and resistance for any currency pair, all you really need is a simple barchart of that pair, which shows the open, high, low and close for that pair. Since we also use multiple time frame analysis, we add exponential moving averages to the basic barchart. Using this very simple chart setup allows a trader to see the support and resistance levels very clearly. The majority of forex traders use so many layers of indicators it blocks the basic chart and makes the support and resistance levels difficult if not impossible to see. We keep our charts simple, but conduct rigorous analysis of support and resistance levels on the smaller and larger time frames, along with the trend analysis. All of the images you see in this article show the basic barcharts with the trend indicators attached.
Forex Support and Resistance, Determining Short Term Levels
To determine the short term support or resistance levels, set up the basic barcharts and moving averages on a Metatrader platform and inspect the smaller time frames, like the M5 and M15 time frames. You can inspect these time frames while the pairs are consolidating during your routine daily analysis across multiple time frames. Write down the support or resistance levels numbers on these small time frames. These are the short term support and resistance levels for that particular pair. These are called the intra-day support and resistance levels because these levels have been established in the last 12-18 hours.

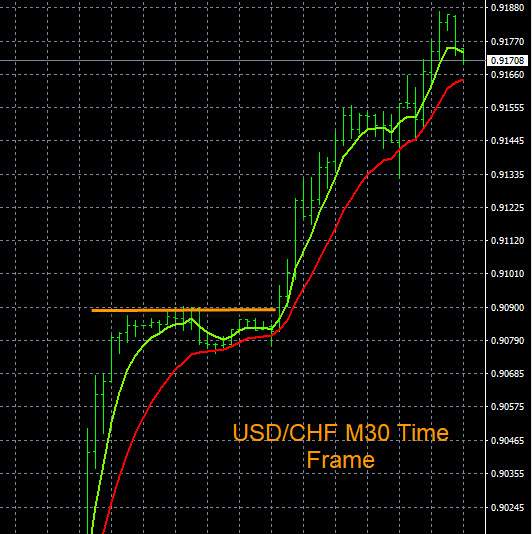
Here is an example of the short term resistance levels on the USD/CHF on the M15/M30 time frame. You can see that the pair moved higher in the main trading session, and now the pair is consolidating near resistance at the yellow line. You can set an audible price alert for a resistance breakout just above the consolidation point price, which is the yellow line in this image. When the price alert hits you will be notified by audible alert or email.
Forex Support and Resistance, Determining Long Term Levels
To determine the long term support and resistance levels on any currency pair, you repeat the process on the short term levels with the same indicators set, but on the higher time frames. So lets look at an example for the H4, D1 and W1 time frame charts. Then traders can write down the long term support or resistance numbers for comparison to the short term support or resistance numbers from the small time frames. This is an easy exercise that any trader can learn.

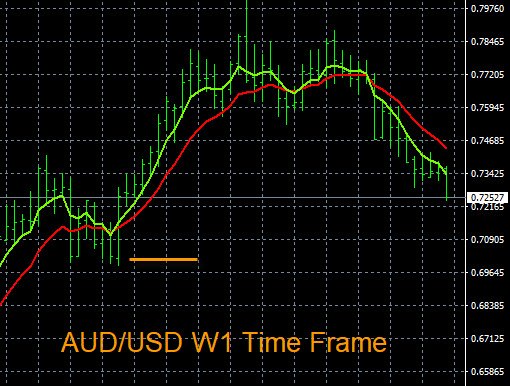
Here is an example of evaluating long term support levels. This chart is for the AUD/USD, set up on the W1 time frame trend. Just below 0.7250 see the yellow line on right. Very easy to spot the current longer term support level. Traders can set a price alert at the 0.7250 level for a trend and price breakout. Below that price there is really no support levels down to the 0.7000 area, so there is 250 pips of potential. This is the benefit of currency pairs that are trending on the higher time frames.
Monitoring Forex Support and Resistance Levels By Setting Price Alerts
Forex price alerts are excellent for monitoring support and resistance levels and have many uses. You can set a price alert to monitor for a breakout in either direction on any pair, for detecting movement, and possibly for triggering buying or selling. You can also set price alerts near target prices and use support and resistance levels for assisting with exit points or profit taking. Typically, you can set a price alert to monitor for a breakout on the smaller time frames. So recheck the image on top of this page (USD/CHF M30 time frame), and you can set a price alert for a support breakout just below the intra-day support indicated by the yellow line.
Then go to the higher time frames to check for the next major support level. Compare the short term support level on the smaller time frames to the longer term support levels on the higher time frames and calculate the difference, in pips. If the difference is 50 pips this is likely not enough pips to try to capture. But if the difference is 200 pips now you have a potential trade with strong potential The second image above shows an example trade with 1000 pips of potential. Most traders are scalpers so working with the higher time frames will give traders far superior pip potential, trade after trade.
Below is a snapshot of how any trader can set price alerts on the Metatrader (MT4) platform. Setting a price alert for one pair takes under 30 seconds.
.jpg)
Forex price alerts are free and can be left in place for any period of time. The alerts are audible on your desktop computer or laptop and the volume can be adjusted on your computer speakers. You can set multiple alarms on multiple pairs and always be monitoring the forex for price movement and breakouts at no cost. This is a phenomenal free tool for forex traders. We also have a short video that shows any trader how to set audible forex price alerts on a Metatrader platform on any pair to help you get started quickly. Monitoring currency pairs with price alarms will help traders to always be informed when the market or their favorite pairs might be moving. Some brokers allow these price alerts to be send to an email address or cell phone so contact your broker about this option. Monitoring forex support and resistance levels for 28 pairs is part of our trading system. All traders and Forexearlywarning clients need access to price alerts.
Price Spikes Versus Areas of Support and Resistance
A price spike is when a currency pair "spikes" of moves up or down quickly for a few seconds or up to a couple of minutes. Price spikes are quick jumps or drops in price that quickly recover back to the same price level. So when you are looking at a chart of that pair you can see most price spikes fairly easily.
.jpg)
A price spike is not very significant when analyzing forex support and resistance. Established areas of support and resistance on a pair are much more important. True areas of support and resistance are not related to spikes. Price spikes can sometimes happen around forex news events. The actual support and resistance levels may be more than 100 pips away from the spikes.
Repetitive Nature of Forex Support and Resistance Levels
Spot forex support and resistance numbers can be highly repetitive on ranging currency pairs. Pairs can range between roughly the same support and resistance levels on any time frame. When pairs range on the higher time frames like the W1 or MN time frame the support and resistance levels can be repetitive over months and years. It’s clear on the charts if you have a close look.
Sometimes the forex market is trending, and other times certain pairs are oscillating or ranging up and down between support and resistance as in the example below. Major currency pairs and exotic pairs do frequently in a non-trending market. The image below shows some nearly repetitive support levels in a larger time frame.
.jpg)
Since we use multiple time frame analysis on 28 pairs every day, spotting pairs that are oscillating or ranging between support and resistance levels is fairly easy. This assists greatly with being on the right side of the trend/movement cycle and knowing when to exit the trade.
Layers, Zones and Clusters of Support and Resistance
Sometimes a currency pair can get stuck in a range of prices. The ranges can be small or wide, and in these cases traders may want to avoid trading these pairs or only execute short term trades. Since the Forexearlywarning traders conduct daily multiple time frame analysis across so many pairs, it is easier for us to identify pairs stuck inside ranges or clusters of support or resistance.
This means that if a pair is bouncing up and down in a tight or fairly wide price range and looks difficult to trade, it probably is. The market is not always trending or oscillating in perfect, smooth cycles and patterns. Trading a market like this is riskier and the incidence of stop outs is more frequent. Trade durations are shorter, or trading should be avoided. Another option we like is to set price alerts on either side of the cluster so we can be notified when the pairs are breaking out of the clusters or ranges. Breakouts are easier to trade, in general, and with our trading system. The overall recommendation is to stay away from clusters or choppy pairs or reduce the number of lots traded significantly, to reduce risk.
Layers of support or resistance can also referred to as choppy markets, tight ranges, clusters, tunnels, and not to confuse anyone with terminology but they are all danger signs pointing to riskier trades. Trading pairs with a lot of room to move up or down, and not stuck in clusters, is easier to trade and profit from.
.jpg)
On this chart above is an example of a support cluster, and a cluster breakout point. This pair has moved down considerably on the D1 time frame and has now formed a support cluster. You can set a price alert below the support cluster or above the support cluster and wait for a clean breakout in either direction. If the pair breaks out it will be able to move better and be much easier to trade with larger trends forming outside of the cluster. Price alarms can be set on both sides of, but outside of the cluster at resistance and support looking for a clear shot at pips. One illustration of a resistance price alert point outside of the cluster is shown by the yellow line, traders should set a price alert at this resistance level to notify of a possible breakout.
Remember this concept - currency pairs move because one currency is strong or the other is weak, or both. The reason clusters form is because both currencies are strong or weak, or both currencies are not moving. This simple fact is ignored by almost all traders but can be easily verified by the charts.
Straddle Alerts, Monitor Support AND Resistance On The Same Pair
Currency pairs can also form clusters on the smaller time frames. In this case the pair is just consolidating after a movement cycle. If these intra-day consolidations go on for more than one day, traders can set a straddle alert if the direction of the market is not clear. A straddle alert is two price alerts on the same pair, one is above the higher breakout point, and one is below the lower breakout point, on the same pair. A resistance alert and support alert set simultaneously on the same pair to detect movement in either direction.
Here is an example of a straddle alarm for the GBP/JPY pair. In this case after a thorough analysis of the JPY it looks like this pair could reverse back to the upside.
But the GBP remains weak on th hgher time frames, so there is some uncertainty as to what direction the pair will go next. To compensate for the uncertainty, a straddle price alert is set on this pair. The alert points are indicated by the yellow lines on either side of the consolidation/cluster. The reason you set two price alerts on the same pair is that you just do not know what direction the pair will go based on your overall assessment of the market.
.jpg)
In this case if the resistance alert hit, you have a clear potential for movement back up for about 190 pips. If the lower price alarm hits, the next support level is about 200 pips away, so essentially this pair is a good opportunity for a trader in either direction, once the sluster is broken.
What To Do When The Price Alerts Go Off
So now you know how to analyze pairs for support and resistance levels, and also how to set price alerts. Now the question is "What do I do when the alarms go off?" You are now monitoring one or more pairs with price alarms. The main trading session starts and the heaviest period of market activity is starting, including a lot of the forex news drivers.
At some point one or more of your price alarms hits and will go off and the forex market starts moving. Now you get in front of the computer to see if you should enter a trade. Price alarms will tell you that the market is moving but you still need to verify your trade entries.
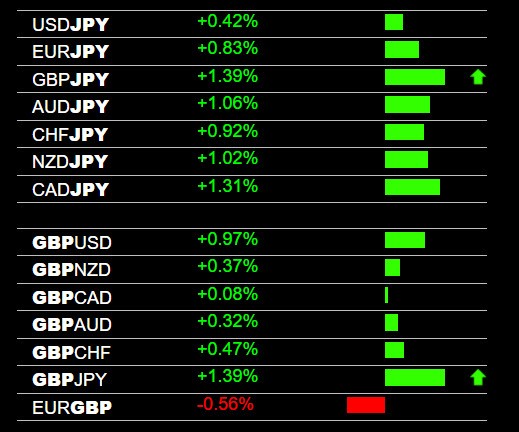
To verify all trade entries we use The Forex Heatmap®. The Forex Heatmap® tells you at a glance what currencies and pairs are strong or weak and verifies whether or not you should enter a buy or sell on the pair where support and resistance is broken. Or it could possibly identify an entry on another pair in the same parallel or inverse group of pairs. Price alarms detect price movement but it could be a price spike or fake out, as discussed above. It is always best to verify your forex trade entries with a reliable real time tool like the heatmap.


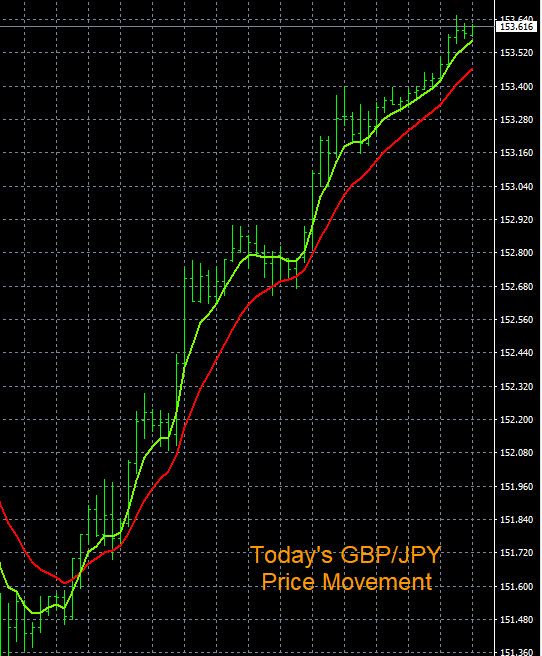
Reading the Forex Heatmap® is not difficult. The above example shows a buy signal for the GBP/JPY. The JPY is weak in real time and there is some slight GBP strength, so the GBP/JPY makes a very strong move upward. If the GBP/JPY hits strong resistance at the end of the move, you can scale out lots or exit the buy trade. For different heatmap configurations you can quickly see the pockets of strength and weakness on the spot forex at a glance and get your trade platform ready when the configurations are set. So after the price alerts hit, check the heatmap to verify any buys or sells. Our library of example forex trade entry signals will show you various examples of trading signals for 28 pairs.
Draw Forex Support and Resistance Levels On Your Charts
Most charting platforms have tools for drawing forex support and resistance levels. These tools make it easy to visualize the levels that exist on any pair. On the Metatrader (MT4) platform, traders can click on the cross hairs drawing tool and immediately start to move the cross hairs across any chart to visualize short term and longer term support and resistance levels.
.jpg)
.jpg)
Here is an example for the NZD/USD on the W1 time frame downtrend. Click on the cross hairs indicator and within 30 seconds you can see that the current support is around 0.6800. Below there the next major support level is around 0.6600. So if a price breakout occurs to the downside you have about 200 pips of potential, which is much higher than forex traders are used to. So in under a minute you can know this information, then decide if this is a pair you might be interested in selling. If so then go ahead and set a price alert to monitor for a downside price breakout.
Forex Support and Resistance Examples
A complete library of support and resistance examples are available on our blog. These examples will illustrate forex support and resistance levels for most of the pairs we trade on various time frames. There are over 100 examples of short term and long term support and resistance on our blog, along with examples of layers and clusters and where to set price alerts. All of the images and charts you see in this article are examples of our free forex trend indicators, which are exponential moving averages attached to a simple open, high, low, close chart.
Summary and conclusions about forex support and resistance levels:
Knowing the short term and longer term support and resistance levels of any pair is part of our trading system. All trends start and end at support and resistance, all consolidations, retracements and reversals start at support and resistance. Setting price alerts can be useful in monitoring 28 pairs for price breakouts and for initiating trades. Support and resistance levels can also be used for setting price targets and estimating exit points. Looking for pairs with lots of pip potential and avoiding clusters and layers of support and resistance on your trade entries will improve your trading and increase the number of pips you capture week after week.
